
The Graphical Syllabus
How visual communication can help students understand course policies

I often hear faculty complain that students don’t read the syllabus.
Fair enough, they usually don’t. When I was a student this past spring, I didn’t read the syllabus either. Why would I? It’s a long and unwieldly document1 that includes policies specific to the individual course intermixed with boilerplate language about institutional policies and resources. Reading a syllabus is a sifting game: can you pick out the relevant information from all the other stuff?
To help my students home in on my course-specific policies, I use a one-page Graphical Syllabus. I was inspired to create a Graphical Syllabus because of the recent popularity of scientific papers including Graphical Abstracts. Just like the Graphical Abstract does not replace the written abstract, my Graphical Syllabus is meant to supplement — not replace — the full-length syllabus.2

You can learn a lot about my course just by looking at this Graphical Syllabus. You’ll notice that I use Multiple Grading Schemes, and I’m including a new-to-me “Attendance Challenge.” (This seems contradictory to my claim that Grading attendance hurts students, but this 2024 paper suggests that being able to opt-in to an attendance policy may benefit students by acting as a pre-commitment device, so I’m going to try it this semester.) I also use Late Work Tokens to provide flexibility within a structured system of deadlines and stickers to incentivize certain behaviors without directly affecting the grade.
The Graphical Syllabus is not just there to be pretty — it’s a demonstrated way to improve student understanding of course policies. This recent paper shows that the graphical representation of a course policy increased the number of students who used the policy, suggesting that the graphical representation increased students’ awareness and understanding of the policy. The Graphical Syllabus also aligns with Universal Design for Learning principles by providing multiple means for students to engage with the syllabus.
If you’d like to create your own Graphical Syllabus, I provide my Graphical Syllabus templates as Adobe Illustrator files on my website. Feel free to use, adapt, and share.3 If you don’t use Adobe Illustrator, you could create a Graphical Syllabus using Powerpoint, Canva, or any other illustration tool.
While it takes time to create your first Graphical Syllabus, it’s imminently reusable for future classes and has the potential to onboard students faster as they become acquainted with your course structure and policies.
Here’s to quick onboarding and engaged students. Happy start to your fall semester!
Not everything you read on the internet was written by a human. For full transparency, here is how I used AI to help me write this post:
I did not use AI to help me write this post.
My full syllabus for this semester is 19 pages single spaced.
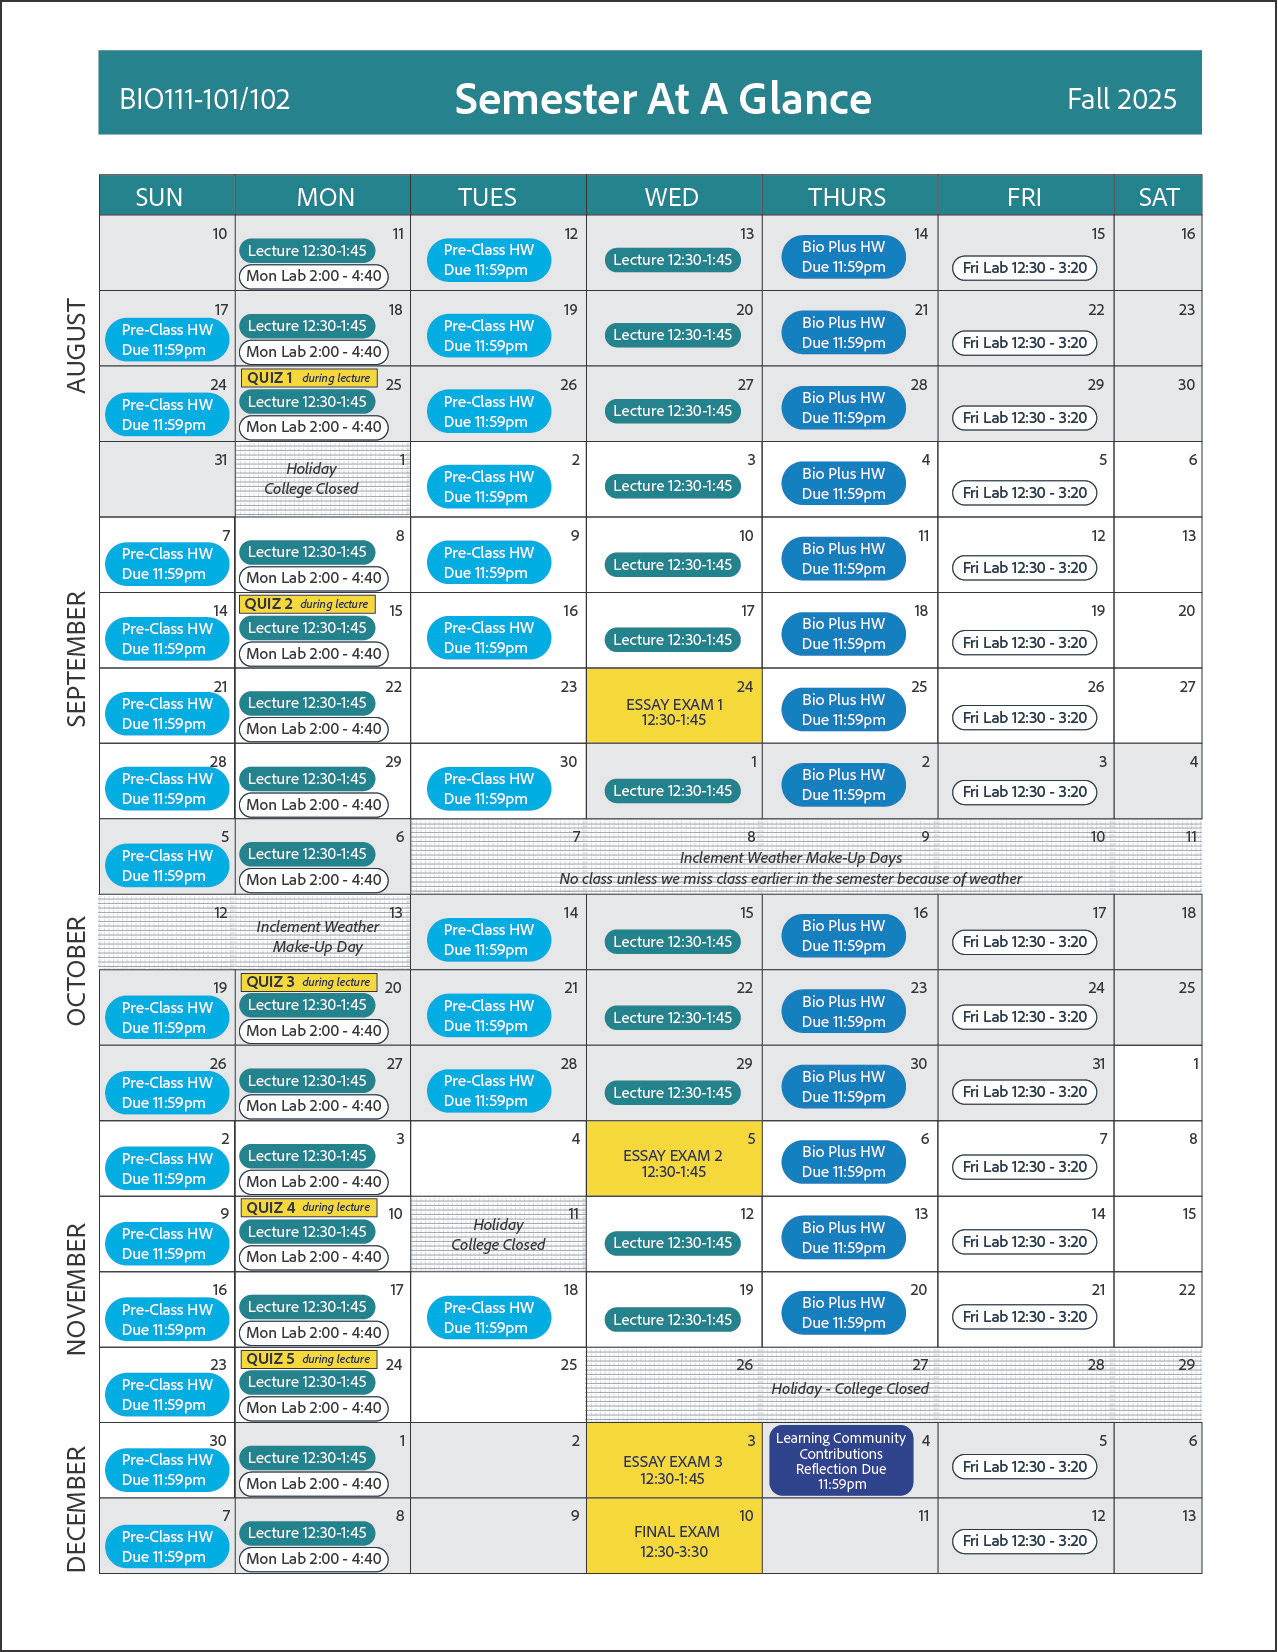
My one-page Graphical Syllabus is accompanied by a one-page Semester at a Glance (see below). Together, the two documents introduce almost every aspect of the syllabus that is specific to my course.
I’ve shared my Graphical Syllabus templates under the Creative Commons “non-commercial, share-alike” license, which means you can use and adapt my templates, but you cannot sell the files or derivatives, and you must share them under the same license.
I also find it useful to include a map to my office.